
Spatial Transcriptomics
Achieve TRUE Single-Cell Resolution with Stereo-Seq and DNBSEQ™ technology
We offer local grant programs in the US to ensure the most exciting projects get to try our Stereo-seq solutions!
What is Spatial Transcriptomics?
Spatial transcriptomics reveals cell localization and gene expression in intact tissue samples
While single-cell RNA-Seq (scRNA-Seq) can provide the novel insights of cell tissue, it has its own limitations. First, it requires to release viable cells from whole tissue without any damages or stress, making it harder to recover certain cell types, e.g. neurons in the brain. Additionally, spatial information, such as the relationship between cells and their neighboring cells within a tissue, is missing.
The latest groundbreaking technology, Spatial transcriptomics, can fill this gap by discovering localization of cell types and their associated gene expression within an intact tissue sample.
In 2021, the spatial-resolved transcriptomics was named “Method of the Year 2020” by Nature Methods. This spatial transcriptomics technology allows scientists to obtain gene expression information in a spatial dimension, furthering the understanding of diseases and accelerating drug or therapy discovery.
Why Choose Stereo-seq for Your Spatial Transcriptomics?
Stereo-seq technology achieves TRUE single-cell resolution
Stereo-seq (SpaTial Enhanced Resolution Omics-sequencing) technology enables:
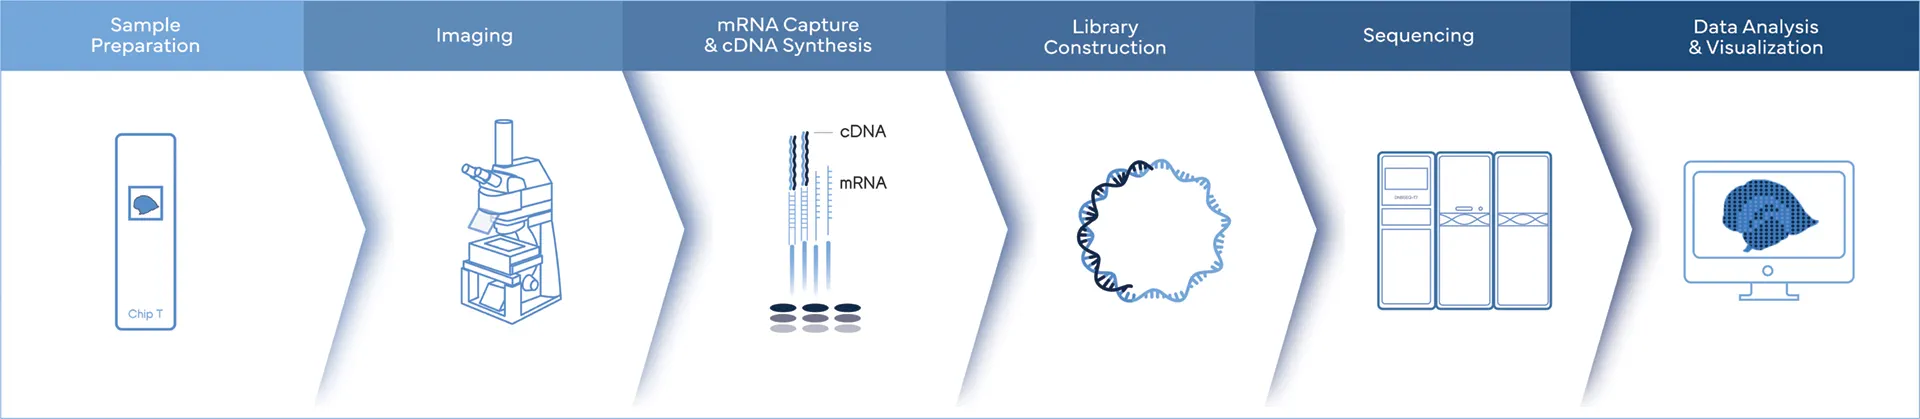
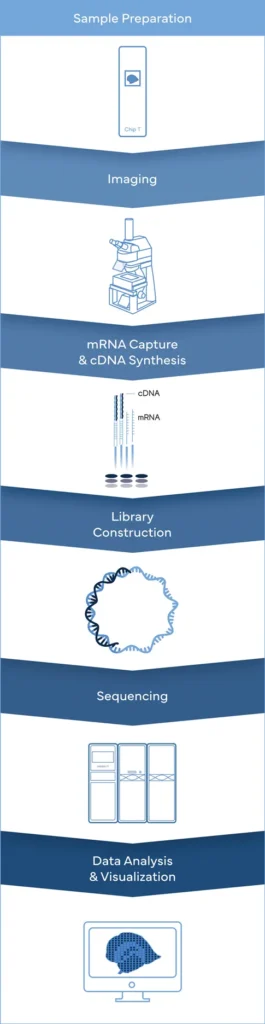
Ultimate Spatial Transcriptomics Workflow
Complete Genomics is the only company, offering the complete spatial transcriptomics workflow solutions.
While Stereo-seq technology captures mRNA directly within tissue using a chip-based method and reconstructs cellular spatial locations through spatial coordination barcoding (Coordinate ID, CID). Meanwhile, DNBSEQ sequencing platforms provide fast, flexible, and cost-effective sequencing workflow.
True Single-cell Resolution
Stereo-seq enables unbiased transcriptome capturing at nanoscale resolution
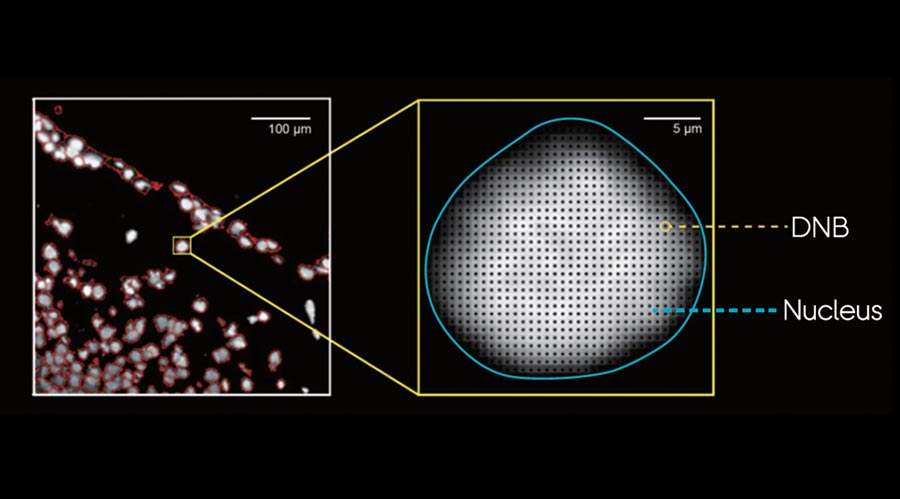
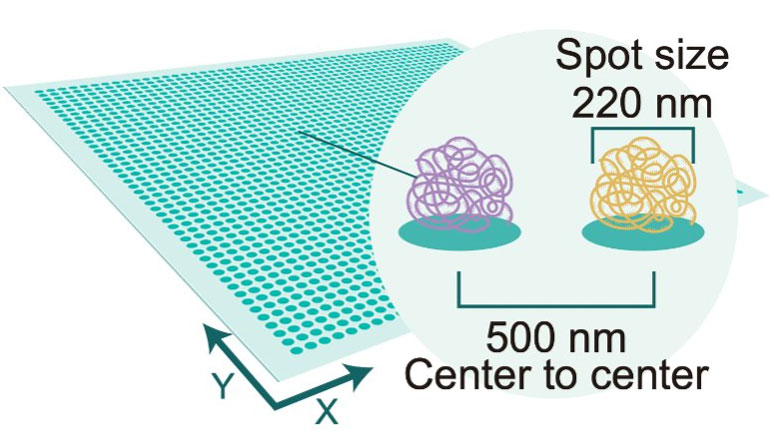
With unbeatable nanoscale of spot size in 0.22 µm in diameter, Stereo-seq technology offers researchers a novel tool to explore spatial biology with unprecedented true single cell resolution at 0.5 µm , enabling simultaneous transcriptome study and analysis at tissue-, cellular-, subcellular- and molecular level from fresh frozen, FFPE, fixed frozen tissues.
Stereo-seq DNB chips have spots with a diameter of 0.22 µm and a center-to-center distance of 0.5 µm which provides up to 400 spots per 100 µm2, thereby allowing whole transcriptome mapping at true single cell resolution.
Stereo-seq vs Competitors
| Company | Product name | Resolution (µm) | Spot size (µm) | Capture area | Species | Sample Type |
|---|---|---|---|---|---|---|
| STOmics | Stereo-seq FF transcriptomics | 0.5 | 0.22 | From 5 mm x 5 mm Up to 132 mm x 132 mm | All | Fresh Frozen Fixed Frozen |
| Stereo-seq OMNI | 0.5 | 0.22 | From 5 mm x 5 mm Up to 132 mm x 132 mm | All | FFPE | |
| 10x Genomics | Visium HD | 2 | 2 | 6.5 mm x 6.5 mm | Human Mouse | Fresh Frozen Fixed Frozen FFPE |
| Curio Bioscience | Seeker | 10 | 10 | 3 mm x 3 mm 10 mm x 10 mm | All | Fresh Frozen |
Large Capture Area
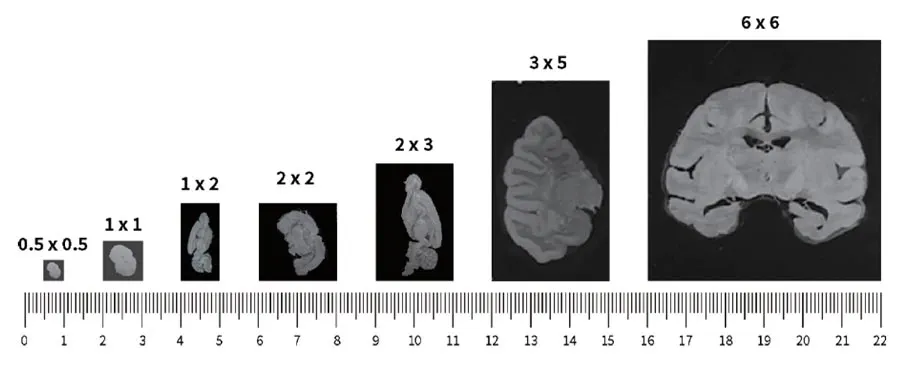
Stereo-Seq accommodates larger tissue samples by offering a centimeter-level field of view
The standard chip size for Stereo-Seq is 1 cm x 1 cm and can be expanded up to 13 cm x 13 cm. Enlarging the capture area allows the measurement of whole mammalian embryos, human organs, or model organisms.
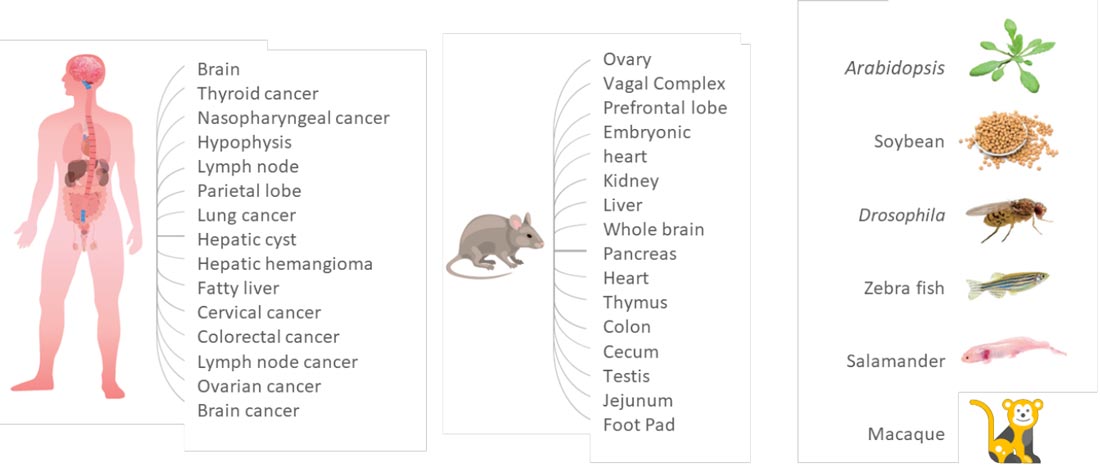
Species Agnostic
Stereo-seq technology supports diverse tissue types and species, and works with Fresh/Fixed frozen and FFPE samples
Stereo-seq Transcriptomics Solution utilizes a capture method for poly-adenylated mRNA capture which supports a wide range of tissue types and species including human, animals, and plants.
Using Multiplexed Multi-Omics to Study Spatial Heterogeneity in Ovarian Cancer
Studying the spatial organization of all the cells in the niche or neighborhood of a tumor is crucial to fully understand how cancers progress. Since proximity speaks to cellular activity, the spatial positioning of cells certainly plays a role in modulating clinical outcomes. However, most platforms used to reconstruct the tumor ecosystem (TE) fail to include spatial context in the three-dimensional (3D) space of a solid tumor with single-cell resolution, and thus lack information on cell-cell or cell-extracellular matrix interactions.

Breakthrough in Spatial Transcriptomics
with Stereo-seq

Systematic comparison of sequencing-based spatial transcriptomic methods
Jul 4, 2024
This study benchmarks 11 spatial transcriptomic methods, including Stereo-seq, to provide critical insights into performance, assisting researchers in selecting appropriate platforms and establishing evaluation standards for spatial transcriptomic analysis.

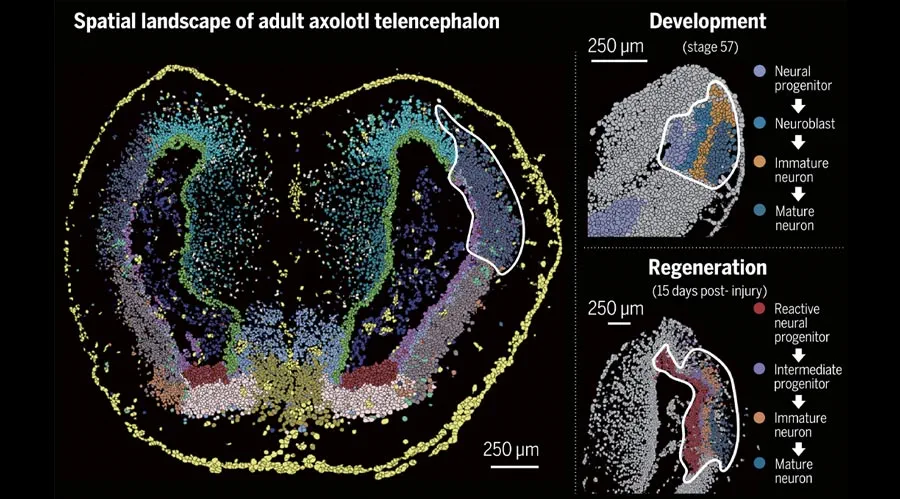
Single-cell spatial transcriptome reveals cell-type organization in the macaque cortex
Jul 12, 2023
Utilizing Stereo-seq, this study maps the macaque cortex at single-cell resolution, uncovering primate-specific cell types and their regional distributions to offer a valuable resource for understanding brain function, development, and disease.
An invasive zone in human liver cancer identified by Stereo-seq promotes hepatocyte–tumor cell crosstalk, local immunosuppression and tumor progression
Jun 19, 2023
Using Stereo-seq, a novel tumor border invasive zone was identified and characterized in liver cancer patients displaying strong immunosuppression and severely damaged hepatocytes which may aid in the understanding of disease progression as well as the development of novel therapeutic strategies for solid tumors.
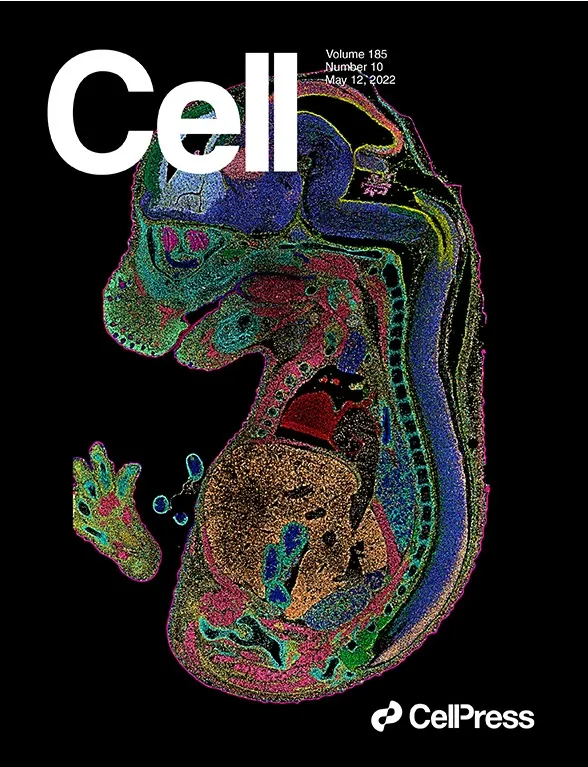
Featured in the Journal Cell
Spatiotemporal Transcriptomic Atlas of Mouse Organogenesis Using DNA Nanoball-patterned Arrays
Cell. 2022; 185: P1777-1792.E21, May 12, 2022
“Spatially resolved transcriptomic technologies are promising tools to study complex biological processes such as mammalian embryogenesis. However, the imbalance between resolution, gene capture, and field of view of current methodologies precludes their systematic application to analyze relatively large and three-dimensional mid- and late-gestation embryos. Here, we combined DNA nanoball (DNB)-patterned arrays and in situ RNA capture to create spatial enhanced resolution omics-sequencing (Stereo-seq).
We applied Stereo-seq to generate the mouse organogenesis spatiotemporal transcriptomic atlas (MOSTA), which maps with single-cell resolution and high sensitivity the kinetics and directionality of transcriptional variation during mouse organogenesis. We used this information to gain insight into the molecular basis of spatial cell heterogeneity and cell fate specification in developing tissues such as the dorsal midbrain. Our panoramic atlas will facilitate in-depth investigation of longstanding questions concerning normal and abnormal mammalian development.”
https://doi.org/10.1016/j.cell.2022.04.003
FAQ
We Offer Grant Programs in the U.S.
A chance to test the TRUE Single-cell Resolution for FREE!
Connect with our experts
Feel free to reach out with any questions – we’re here to assist!