
Stereo-seq Transcriptomics FF Large Chip Design
See the Whole Picture
Spatial Transcriptomics without Boundaries
Ultra-Wide Spatial Profiling for Large Tissues and Whole Organs
Traditional spatial transcriptomics platforms are limited by their capture areas, which restricts their utility for studying large-scale tissue architecture, whole-organ developmental processes, or mapping disease progression across large tissue sections. The Stereo-seq Large Chip Design (LCD) is uniquely suited and currently the only available platform for cross-species studies of large organs, allowing for direct comparative mapping of conserved and divergent spatial gene expression patterns across different model organisms. Stereo-seq Large Chip Designs overcome this by enabling ultra-wide spatial profiling, capturing centimeter-scale tissue sections at single-cell resolution, without sacrificing sensitivity or throughput.
Whole-organ and large tissue on one chip
Capture centimeter-scale tissue sections at single-cell resolution on a single chip.
3D Atlas construction
Integrate serial sections to reconstruct comprehensive 3D spatial atlases.
High-throughput and scalability
Scale up spatial profiling acrossmultiple samples with consistent high throughput.
Various Chip Sizes to Fit Your Spatial Biology Needs
1 cm x 2 cm
Mouse embryo E16.5
RIN: 8.1
Total reads: 3.6B
Sequencing saturation: 63.8%
Median gene type counts per cellbin: 284
2 cm x 2 cm
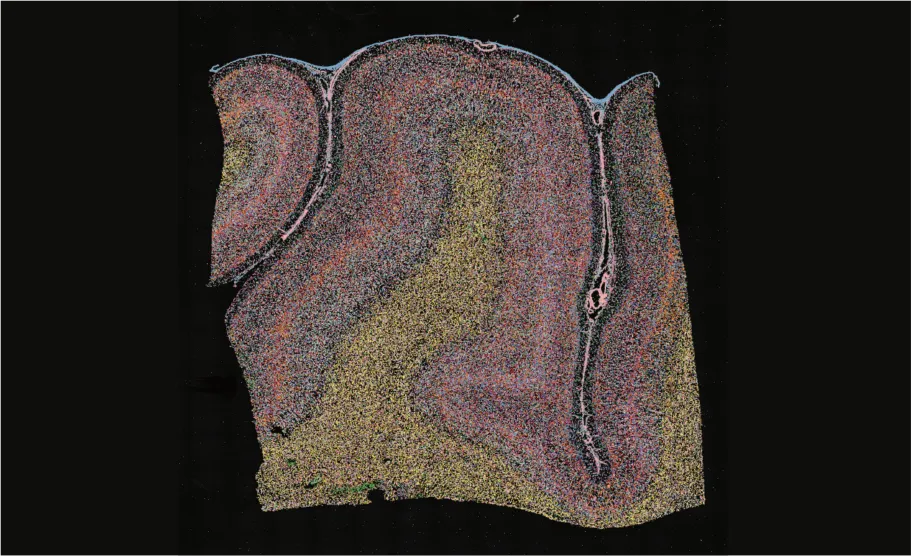
Macaque brain RM-8A
RIN: 7.5
Total reads: 3.6B
Sequencing saturation: 16.4%
Median gene type counts per cellbin: 382
2 cm x 3 cm
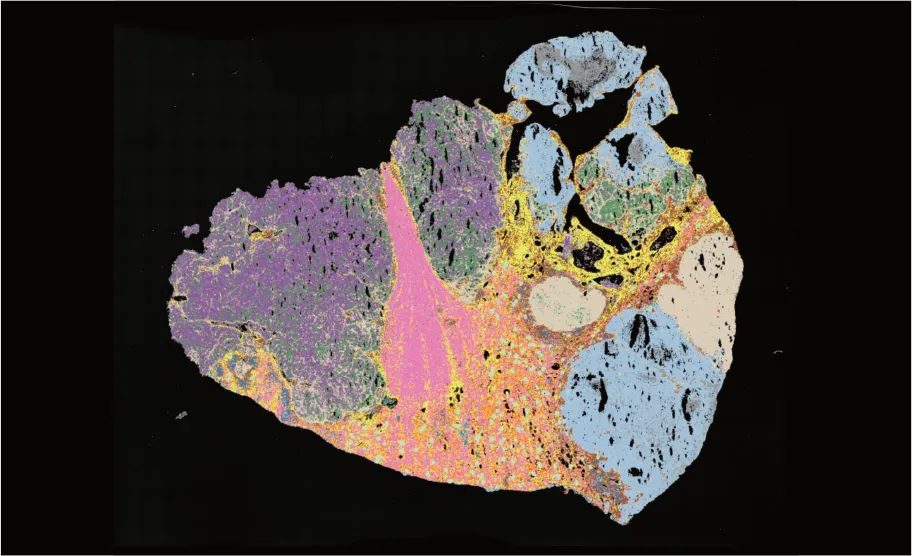
Human renal carcinoma PT1
RIN: 7.8
Total reads: 4.1B
Sequencing saturation: 32.6%
Median gene type counts per cellbin: 188
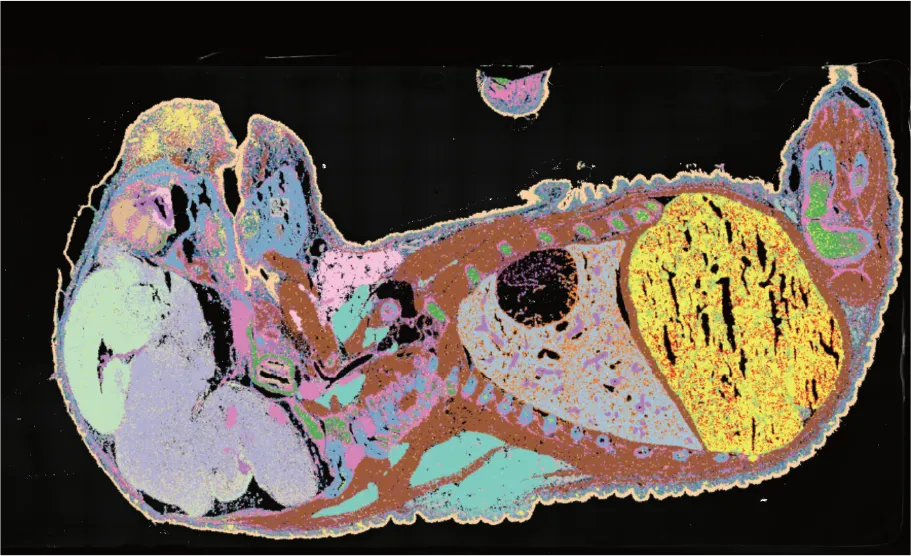
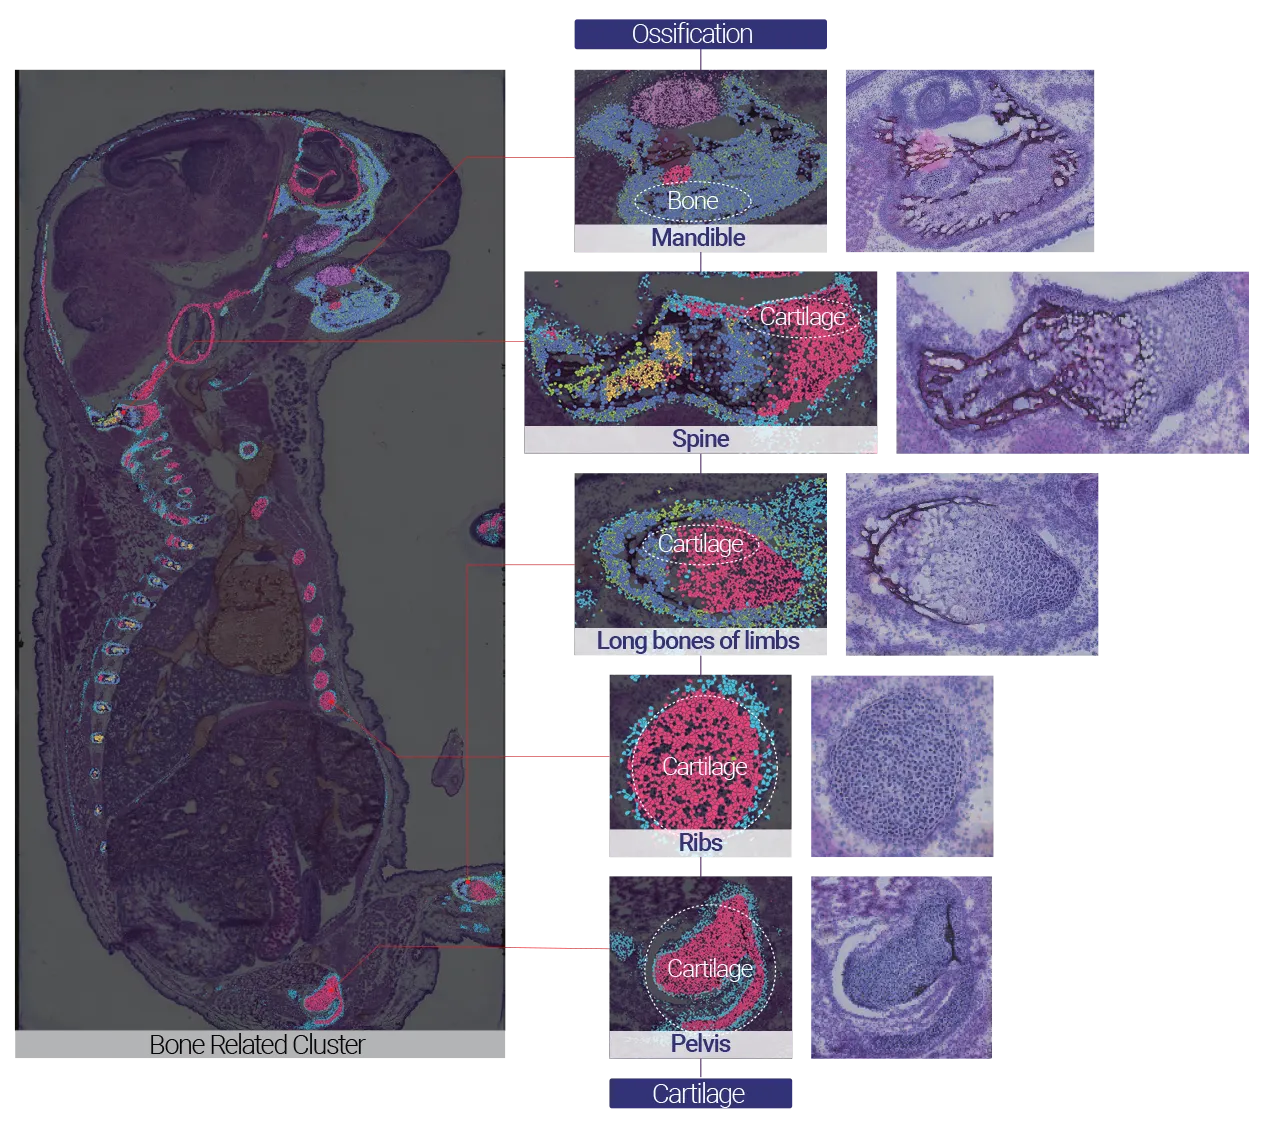
Capturing Whole-Embryo Skeletal Development with a 1 cm × 2 cm Chip
The mandible, spine, ribs, pelvis, and long bones in the mouse embryo primarily undergo endochondral ossification, a fundamental process underlying fracture healing. In this process, chondrocytes first proliferate, enlarge (hypertrophy), and eventually undergo apoptosis, after which they are replaced by bone tissue. Using 1 cm × 2 cm large chip, it was possible to spatially capture and resolve the entire embryonic skeletal system within a single section, enabling region-by-region comparison of ossification states across multiple structures simultaneously.
Metrics
Tissue
Mouse Embryo E18.5
Chip Size
1 cm x 2 cm
Total Genes
29,221
Cell Count
1,191,859
RIN Value
8.4
Key Highlights
Stereo-seq Large Chip Design Applications
Stereo-seq LCD expands the scale of spatial transcriptomics by capturing whole organs and centimeter-scale tissue sections at single-cell resolution. This capability enables comprehensive mapping of complex biological systems across species, accelerating research in developmental biology, neuroscience, oncology, and evolutionary biology. By integrating large-scale spatial context with cellular detail, Stereo-seq LCD drives the discovery of conserved molecular pathways, disease mechanisms, and new therapeutic targets.
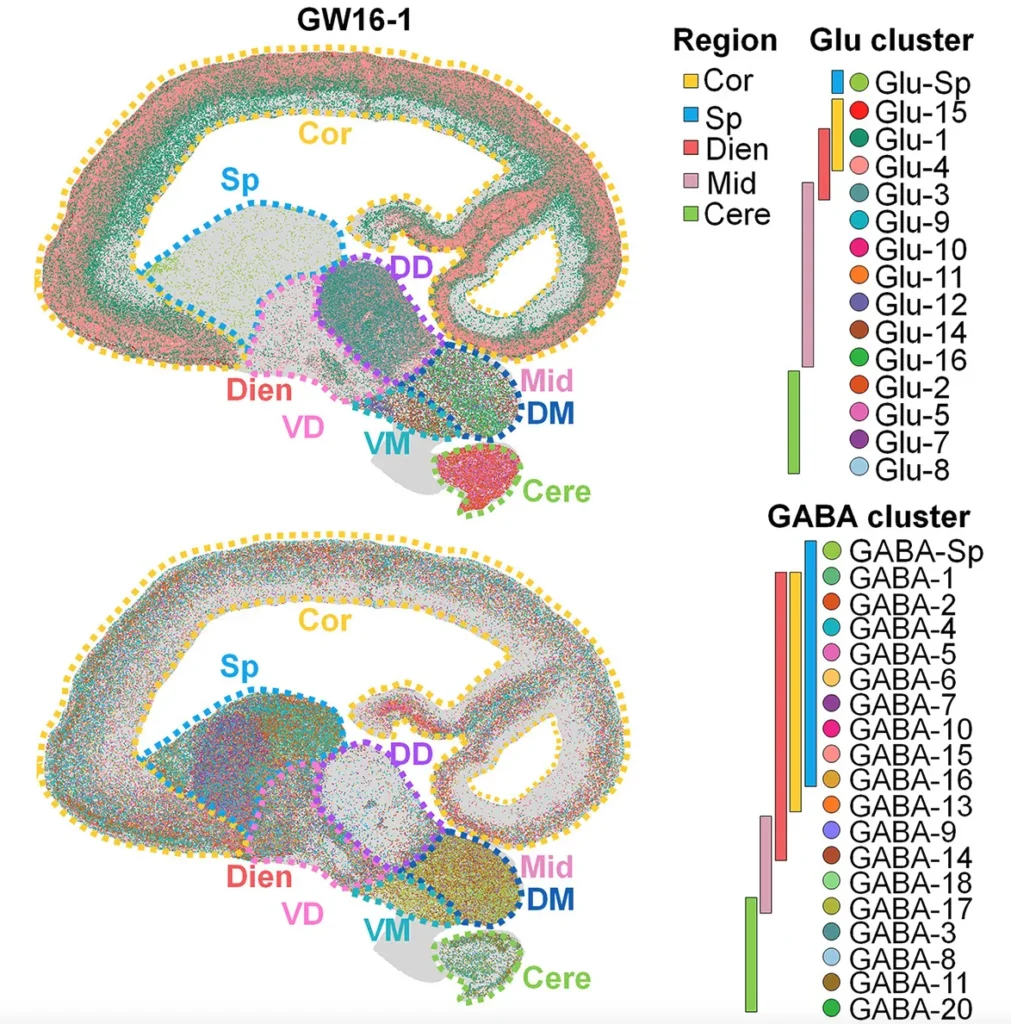
Stereo-seq LCD Reveals Regional Specification During Human Brain Development
Li et al. built a spatiotemporal single-cell transcriptomic atlas of the developing human brain spanning gestational weeks 6–23, by integrating scRNA-seq with Stereo-seq LCD spatial profiling across five major brain regions. Using centimeter-scale human brain sections captured at single-cell resolution, the team uncovered how radial glia subtypes exhibit region-specific heterogeneity that drives neuronal specification.
Stereo-seq LCD enabled continuous spatial mapping across large brain areas, revealing how dorsal–ventral patterning, glia–neuron interactions, and regionally distinct progenitor populations shape human brain architecture. This comprehensive atlas provides a foundation for understanding human neurodevelopment and neuropsychiatric disorders (Li et al., Cell, 2023).
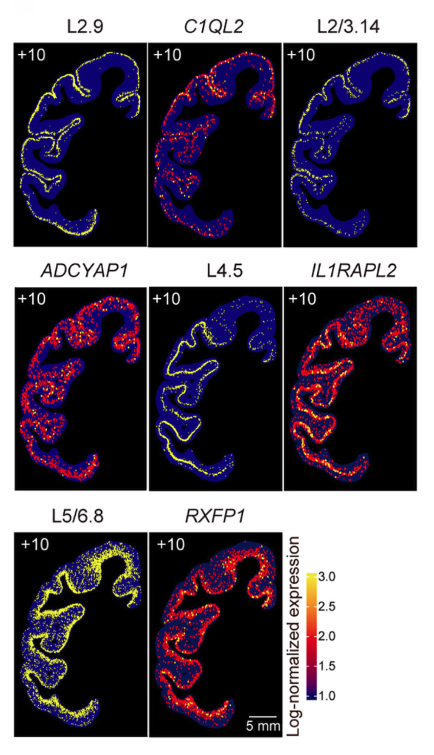
Stereo-seq LCD Maps the Cellular Architecture of the Macaque Cortex
Chen et al. constructed the first single-cell-resolution spatial transcriptome atlas of the macaque cortex using the Stereo-seq Large Chip Design (LCD), capturing centimeter-scale cortical sections across multiple regions. This high-resolution atlas revealed distinct laminar organization, interareal gene expression gradients, and species-specific neuronal subtypes not observed in rodents.
Leveraging the ultra-wide capture area of Stereo-seq LCD, the study integrated data from 1.2 million cells to map the distributions of excitatory and inhibitory neurons and trace molecular specialization across cortical regions. These results provide critical insight into the evolutionary expansion and functional diversification of the primate neocortex (Chen et al., Cell, 2023).
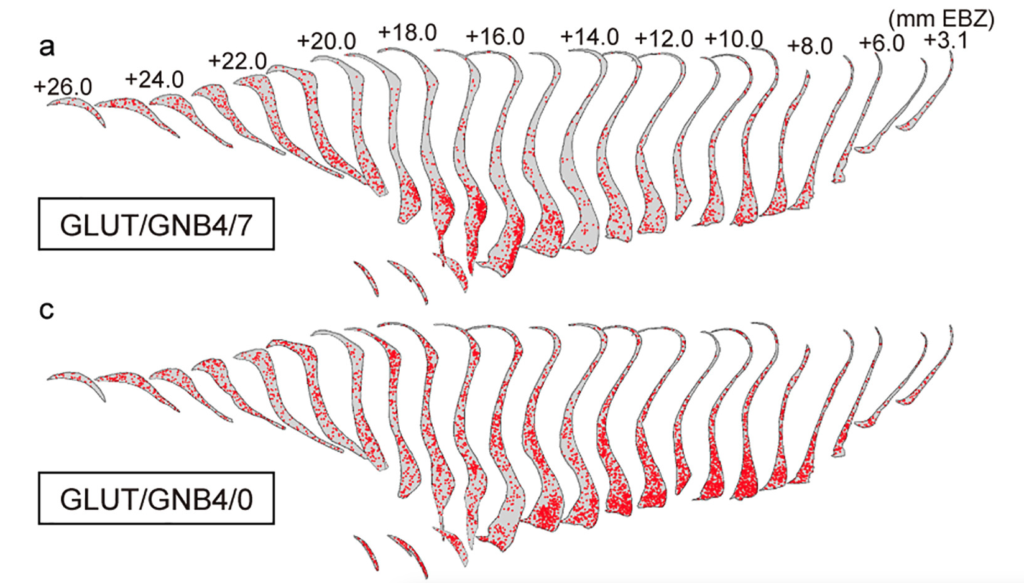
Stereo-seq LCD Mapped Cross-Species Connectivity of the Primate Claustrum
The Stereo-seq LCD enabled single-cell-resolution mapping across centimeter-scale macaque brain sections, revealing the cellular architecture and connectivity of the claustrum. Using Stereo-seq LCD, researchers generated a spatial transcriptome atlas of the entire claustrum. They integrated it with whole-brain retrograde tracing to uncover four spatially distinct projection zones containing unique glutamatergic cell compositions.
By combining single-cell RNA-seq with ultra-wide spatial profiling, the study demonstrated macaque-specific neuronal subtypes that link memory-related (entorhinal cortex, hippocampus) and motor-related (motor cortex, putamen) circuits, providing the first comprehensive, cross-species claustrum connectome (Lei et al., Cell, 2025).
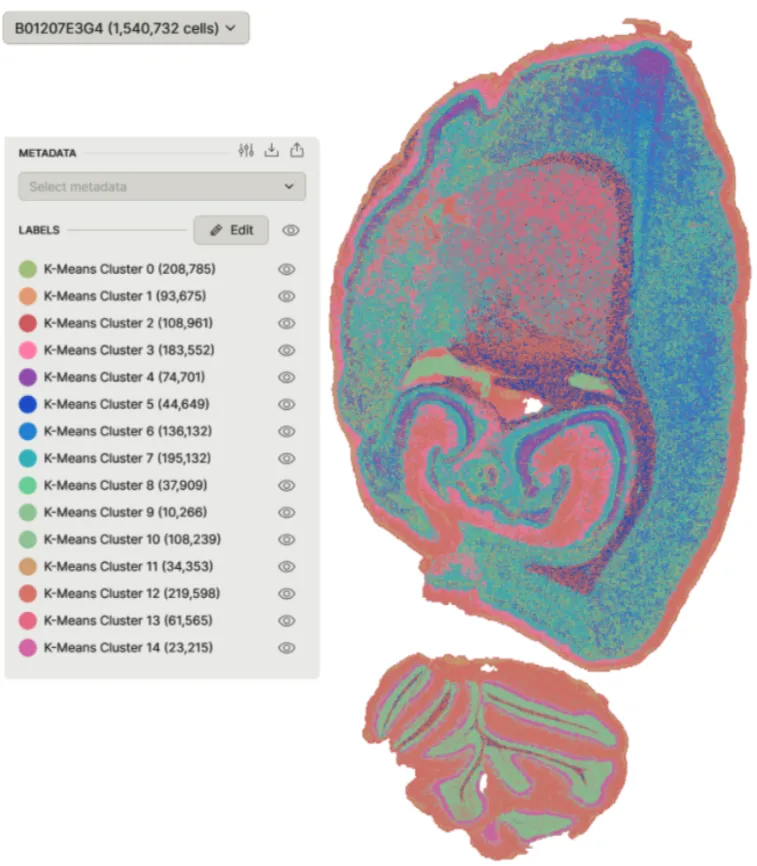
Stereo-seq LCD Uncovered Cellular Diversity in Rat Brain
Stereo-seq LCD 2 cm x 3 cm Chip combined with DNBSEQ™ sequencing profiled over 1.5 million cells in the rat brain, revealing the nanoscale spatial organization of transcriptionally distinct regions. The integration of ultra-high-resolution Stereo-seq with advanced clustering revealed 15 distinct spatial gene expression clusters, highlighting functional and structural domains within the brain.
This workflow demonstrated how the Stereo-seq LCD solution revealed intricate spatial heterogeneity and functional specialization within brain tissue by mapping the differential expression of myelination genes, such as Mbp, Ppl1, and Ugt8, across subpopulations.
Ordering Information
| Category | Product | Cat. No. |
|---|---|---|
| Sample Prep | Stereo-seq Transcriptomics Set (1cm*2cm); (2cm*2cm); (2cm*3cm) V1.3 | 111ST13122-CG; 111ST13221-CG; 111ST13231-CG |
| Permeabilization Sets | Stereo-seq Permeabilization Set (1cm*2cm); (2cm*2cm); (2cm*3cm) V1.1 | 111SP11124-CG; 111SP11224-CG; 111SP11234-CG |
| Library Prep | Stereo-seq 16 Barcode Library Preparation Kit V1.1 | 111KL11160-CG |
| Instruments | STOmics Microscope – Go Optical | 900-001019-00 |
| Genetic Sequencer DNBSEQ-T7 | 900-000698-00 | |
| Sequencing Reagents | DNBSEQ-T7RS Stereo-seq Visualization Reagent Set (FCL PE75) | 940-001889-00 |
| DNBSEQ-G400RS Stereo-seq Visualization Reagent Set (FCL PE75) | 940-001885-00 |